






TikTok UGC breakouts by the numbers
- Breakout posts
- 188from 28 brands
- Median views
- 389Kper post
- Vs the account
- 33xits median views
- Ad-tagged
- 28%53 posts
188 TikTok posts from brand creator programs in UGC Brands, posted May 2026 to Oct 2026. Data as of 9 November 2026.
What the TikTok breakouts have in common
- They beat the creator's own baseline by a lot. The median post here got 33x the views of a typical post on the same account, and 389K views in total.
- Most are not labelled as ads. 28% carry a paid-partnership tag in the caption (#ad, #partner or a brand partner tag); the rest read as ordinary posts, which is the point of creator programs.
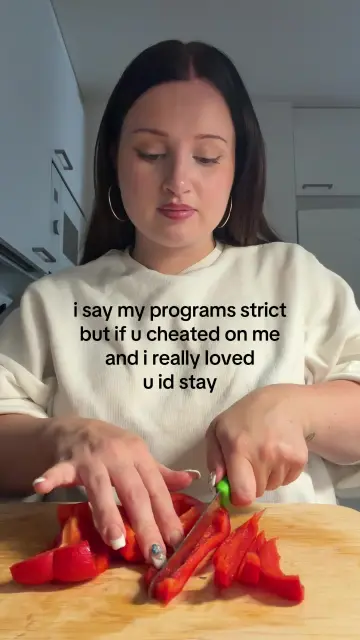
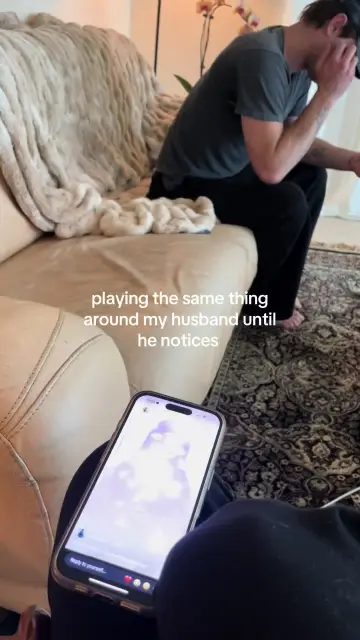
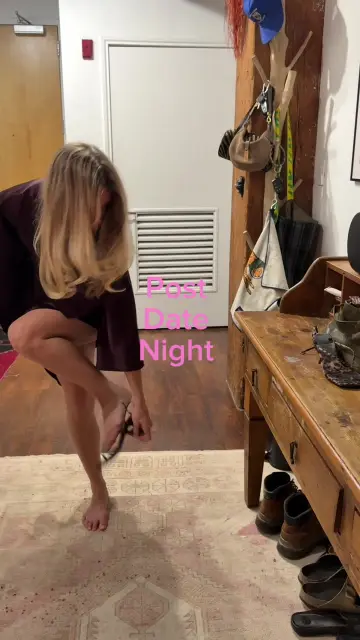
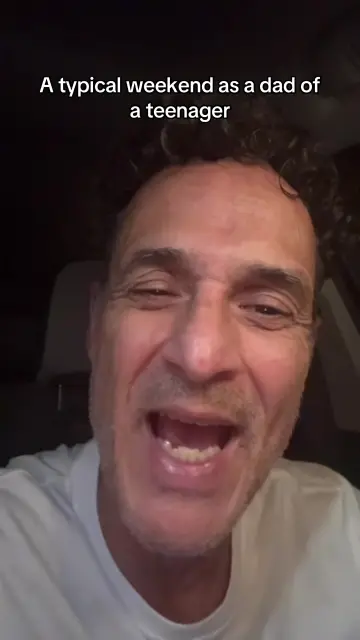
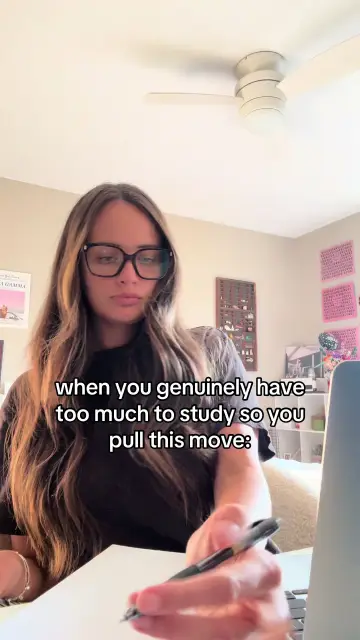
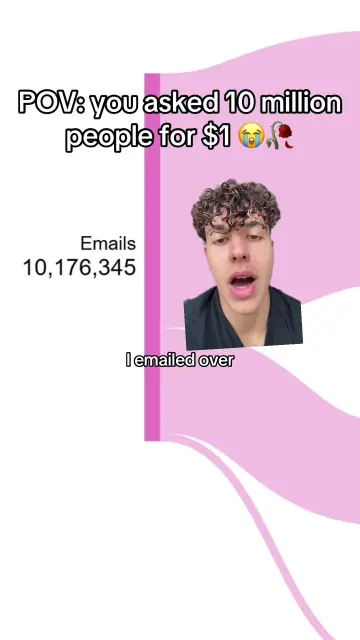
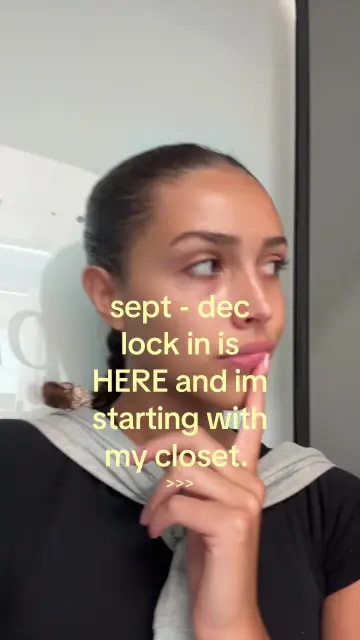
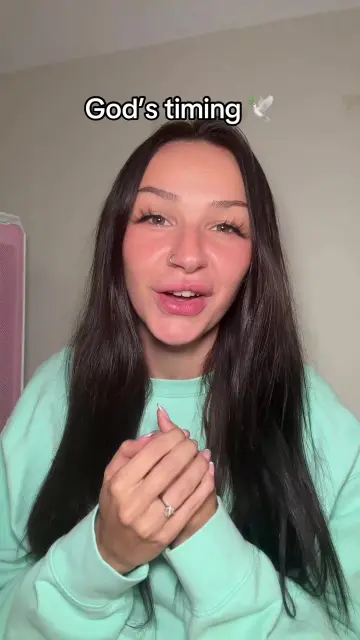
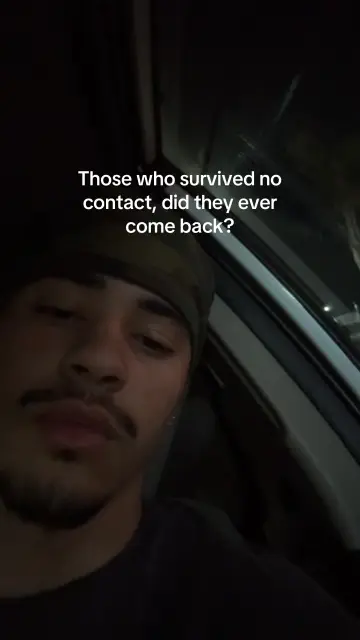
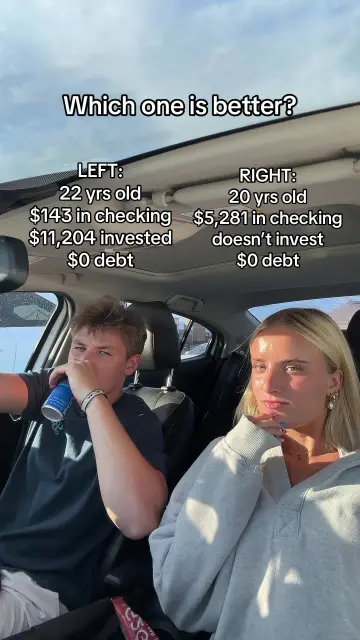
- Formats are looser than on Meta. Skits and POV text make up 35% of the posts, and 3% are photo slideshows, a format that barely exists in winning Meta ads.
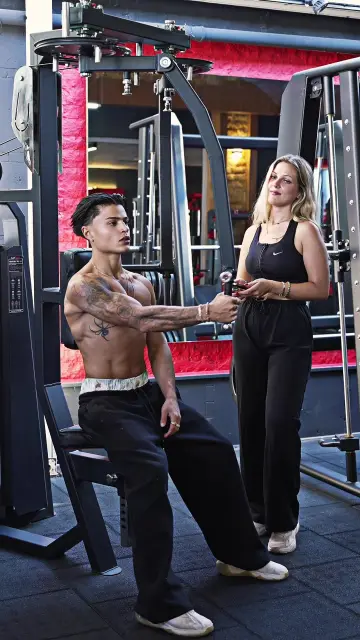
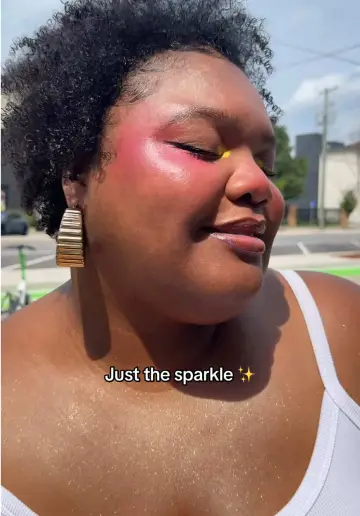
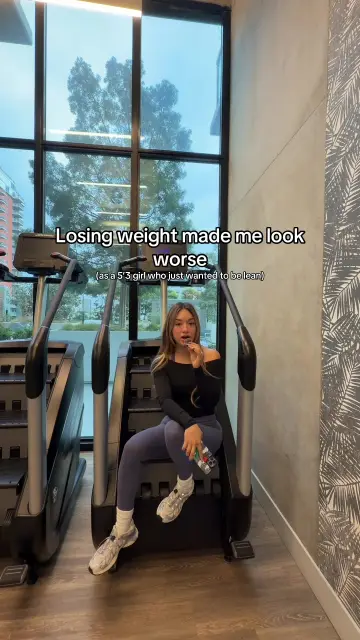
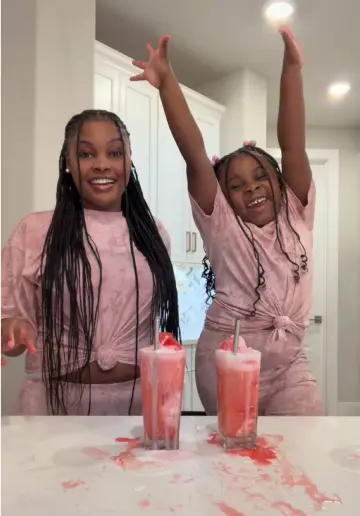
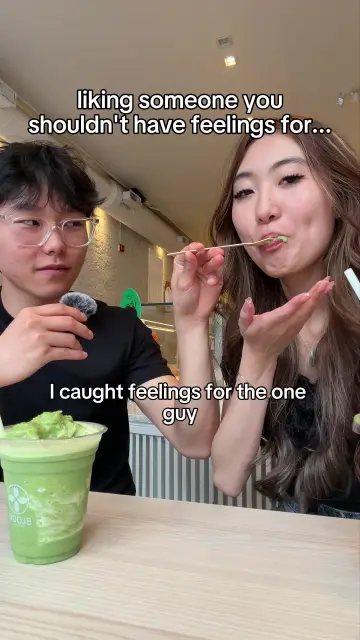
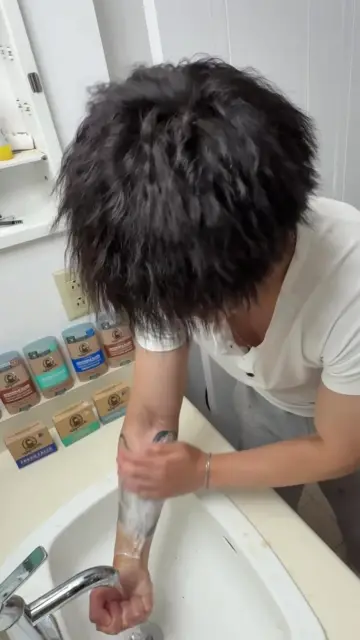
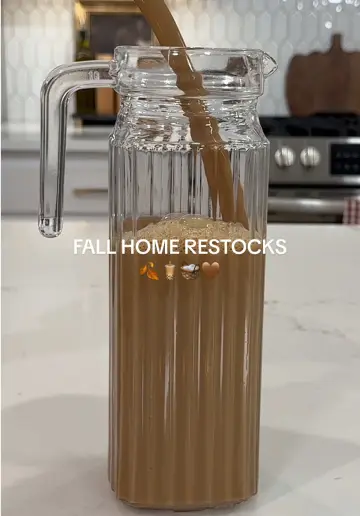
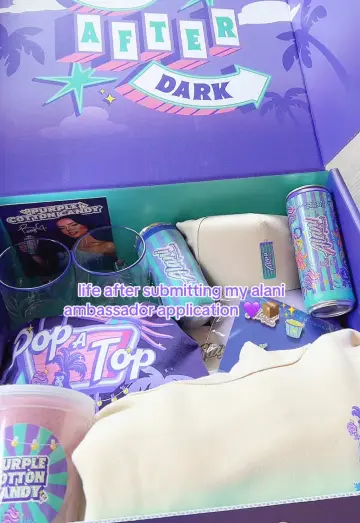
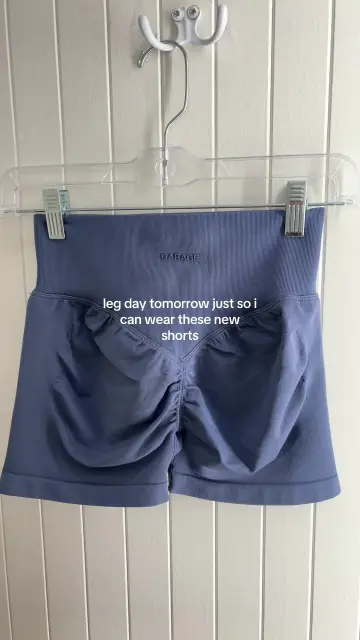
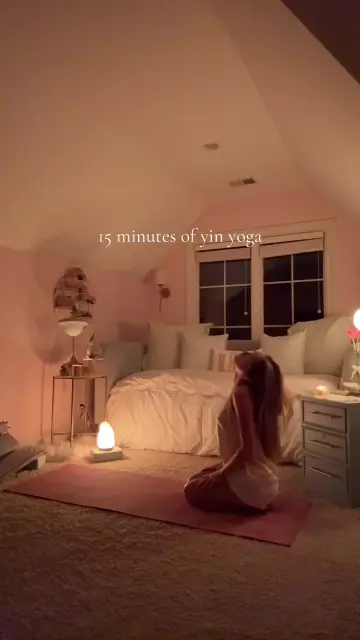
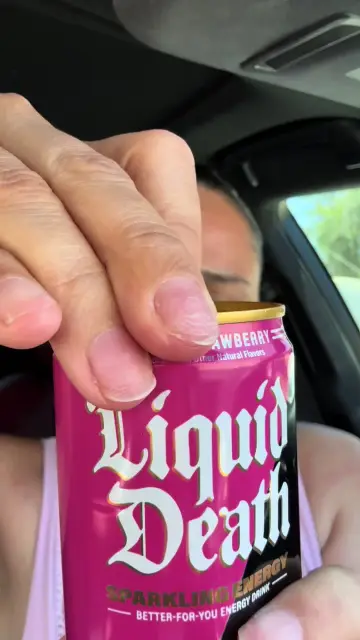
- The hook is in the first line. The caption opener and the on-screen text do the work; the gallery shows each post's first caption line.
- Engagement is high. The median engagement rate is 9.5% (likes, comments, shares and saves over views).
From organic post to Spark Ad
On TikTok the usual path is: creators post under their own accounts, the brand watches which posts break out, and it pays to boost those as Spark Ads, which keep the creator's handle, likes and comments. The posts on this page are the candidates at the moment they broke out. A post that already beat its account's median by 30x has passed a test no brief can run in advance.
Two practical rules from the data: pick by the multiple, not raw views (a 5K-follower account at 40x is a stronger signal than a big account at its usual numbers), and agree boosting rights with the creator before you need them.
Brands with the most TikTok breakouts
| Brand | Breakout posts | Median views | Vs account median | Ad-tagged |
|---|---|---|---|---|
| Cantina | 62 | 418K | 22x | 4 |
| e.l.f. Cosmetics | 22 | 430K | 17x | 22 |
| StudyFetch | 17 | 114K | 119x | 0 |
| Celsius | 16 | 119K | 82x | 2 |
| Turbo AI | 11 | 236K | 101x | 0 |
| Poppi | 8 | 538K | 26x | 5 |
| Cal AI | 7 | 1.5M | 12x | 0 |
| Anara | 6 | 144K | 339x | 0 |
| Locket | 5 | 494K | 396x | 4 |
| Bloom Nutrition | 5 | 666K | 11x | 2 |
| Dr. Squatch | 4 | 416K | 47x | 2 |
| OLIPOP | 4 | 322K | 10x | 4 |
Download this table as a CSV file (CC BY 4.0, link to this page).
How we picked these posts
Posts come from the UGC Brands database: the TikTok accounts we attribute to each brand's creator program, read post by post. A post is a breakout when its views are at least 5 times the median of that account's recent posts. "Ad-tagged" means the public caption carries #ad, #sponsored, #partner or a brand partner or ambassador hashtag; posts with TikTok's own paid-partnership label but no caption tag count as untagged, so the real share is higher.
We show the brand, the first caption line, views, engagement and a cover frame, and link to the public post; we never show the creator's handle or name on this page. Format and who is on camera are labelled by a model and are approximate. 38 of the 188 posts were still public with a cover image when we built this page. This page shows a sample of 24, at most 3 per brand. Correlation, not causation: a brand with more creators has more breakouts.