The clear leader
Beauty is 4.1 percentage points above fitness in this dataset. The category has the largest measured profile share among the five niches reported here.
Beauty appears on 18.6% of the unique creator profiles in this dataset, ahead of fitness at 14.5%. Parenting, fashion, and travel complete the top five.
Aggregate research with the methodology and limitations visible
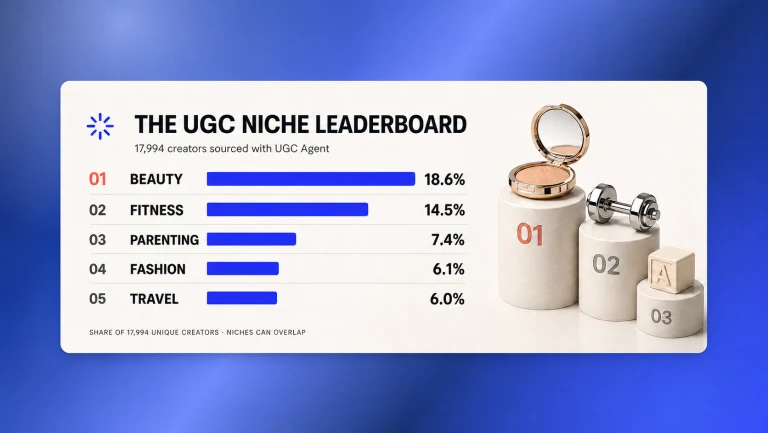
These percentages describe how often each niche appears across the 17,994 unique profiles. They do not describe spending, campaign volume, creator income, or content performance. Read them as the composition of this dataset.
Beauty is 4.1 percentage points above fitness in this dataset. The category has the largest measured profile share among the five niches reported here.
The most useful reading is descriptive and narrow. It compares measured profile shares inside this dataset while avoiding claims the data cannot support.
Beauty measures 18.6% and fitness measures 14.5%. Both sit well above the remaining reported niches. That makes them the clearest high-share categories in the dataset, without implying that either category guarantees easier sourcing or stronger campaign results.
Parenting appears on 7.4% of profiles. Its share is 7.1 percentage points below fitness and 1.3 points above fashion. The number suggests a meaningful presence in the dataset, but it does not reveal subtopics, audience age, geography, or content format.
Fashion measures 6.1% and travel measures 6.0%, a difference of only 0.1 percentage point. The practical conclusion is not that one category is materially larger. It is that both occupy a similar measured tier among these profiles.
The denominator is 17,994 unique creator profiles. Each reported percentage is the share of those profiles associated with a given niche. The analysis is multi-label, which means one profile may belong to more than one niche.
The study reports 17,994 unique creator profiles. Repetition of the same profile is not presented as additional creator volume in the published denominator.
A creator profile may carry multiple niche associations. For example, a profile may reasonably sit across beauty and fashion, or fitness and travel. Because those labels can overlap, adding the percentages does not produce an exclusive distribution.
Beauty at 18.6% means beauty is associated with 18.6% of the 17,994 unique profiles analyzed. It does not mean beauty owns 18.6% of all UGC creators on every platform or in every market.
This page contains no customer-level, user-level, or creator-level data. It publishes category percentages and the overall profile count, not handles, contact information, prompts, account histories, or individual classifications.
A high-share niche may offer a broader starting pool in this dataset, but a creator list still needs to reflect the brief. Product category, location, content style, audience fit, exclusions, and contact requirements can matter more than the niche label alone.
The practical use of this research is planning. It can help teams frame an initial hypothesis about where profile volume appears concentrated. It should not replace creator-level review or UGC creator fit scoring.
Explore a sourcing workflow shaped around routines, demonstrations, testimonials, and category context.
14.5% of profilesBuild briefs around workouts, gear, app tutorials, wellness content, and campaign constraints.
6.1% of profilesSource for try-ons, styling, hauls, launches, and the visual formats the campaign needs.
6.0% of profilesSearch around stays, local experiences, guides, venues, and destination-specific context.
Move from aggregate context to the product, process, and connected workflows that support an actual creator sourcing brief.
See the end-to-end UGC Agent experience for finding, reviewing, organizing, and retaining creator leads.
MethodologyLearn how campaign context can be carried into the review of individual creator profiles.
Source postRead the blog post that introduced the leaderboard and the five aggregate niche shares.
ConnectionsExplore outreach, developer access, MCP, and recurring creator sourcing connections.
Recurring workSchedule repeat sourcing so a defined brief can produce fresh creator work over time.
SourcingTurn niche context and campaign requirements into a structured creator sourcing workflow.
Use the ranking as planning context, then describe the creators your campaign actually needs. UGC Agent can carry the niche, content format, location, product, and campaign constraints into the sourcing workflow. 3-day free trial, no card required. Up to 10 creators show in full during the trial; emails unlock on a paid plan.
Browse 26,791 UGC creators